メモ
この機能を使用するには、サイト管理者が code scanning を有効にする必要があります。 詳しくは、「アプライアンス用コードスキャンの構成」をご覧ください。
Enterprise の所有者が Enterprise レベルで GitHub Code Security ポリシーを設定している場合、code scanning を有効または無効にできない場合があります。 詳しくは、「エンタープライズのコード セキュリティと分析のためのポリシーの適用」をご覧ください。
The ツールの状態ページ shows information about all of your code scanning tools and is a good starting point for debugging problems. For more information about what the tool is and the information it provides, see ツールの状態ページについて.
Viewing the ツールの状態ページ for a repository
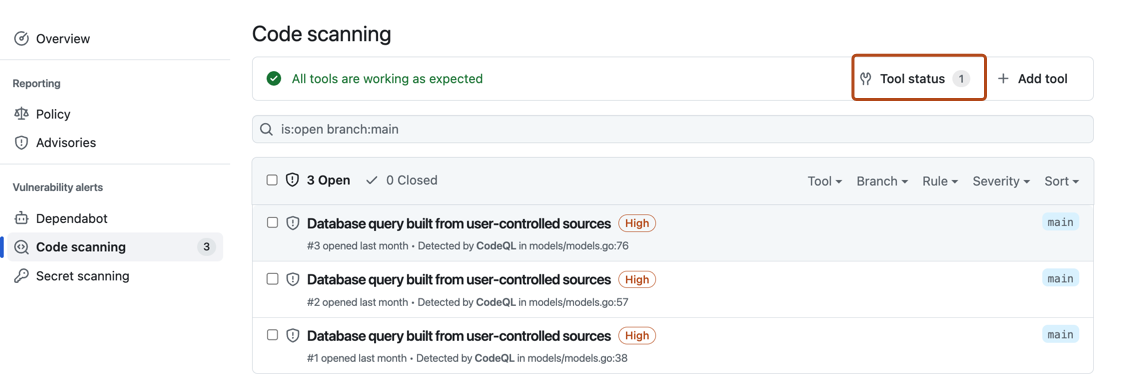
The code scanning alerts page for each repository includes a tools banner with a summary of the health of your code scanning analysis, and access to the ツールの状態ページ to explore your setup.
- GitHub で、リポジトリのメイン ページに移動します。
- リポジトリ名の下にある [Security] をクリックします。 [Security] タブが表示されない場合は、 ドロップダウン メニューを選んでから、[Security] をクリックします。
![タブを示すリポジトリ ヘッダーのスクリーンショット。 [セキュリティ] タブが濃いオレンジ色の枠線で強調表示されています。](/assets/cb-17801/images/help/repository/security-tab.png)
- 左側のサイドバーで、 [Code scanning] をクリックします。
- Click Tool status in the tools banner.
![タブを示すリポジトリ ヘッダーのスクリーンショット。 [セキュリティ] タブが濃いオレンジ色の枠線で強調表示されています。](/assets/cb-17801/mw-1440/images/help/repository/security-tab.webp)

Using the ツールの状態ページ
In the ツールの状態ページ, you'll see a summary for one tool, highlighted in the sidebar. You can use the sidebar to view summaries for different tools.

For integrated tools such as CodeQL, you can see a percentage total of all the files most recently scanned in your repository, organized by programming language. You can also download detailed language reports in CSV format. See Downloading details of the files analyzed.
Accessing detailed information about tools
When you want to see more detailed information for the currently displayed tool, you can select a specific setup under "Setup types".
Under "Configurations" on the left of the screen, you can see information for each analysis run by this setup type, and any relevant error messages. To see detailed information about the most recent analysis run, select a configuration in the sidebar. You can download details of exactly which rules were run in that scan of the code and how many alerts were found by each rule. For more information, see Downloading lists of rules used.

This view will also show error messages. For more information, see Debugging using the tool status page.
Downloading details of the files analyzed
For integrated tools such as CodeQL, you can download detailed reports from the ツールの状態ページ in CSV format. This will show:
- Which configuration was used to scan each file
- The file path
- The programming language of the file
- Whether the file was successfully extracted
To download a report, select a tool you're interested in. Then on the top right of the page, click the button.
Downloading lists of rules used
You can download the list of rules that code scanning is checking against, in CSV format. This will show:
- The configuration used
- The rule source
- The SARIF identifier
- How many alerts were found
To download a report, select a configuration you're interested in. Then click on the top right of the page, and select Download list of rules used.
Removing configurations
You can remove stale, duplicate, or unwanted configurations for the default branch of your repository.
To remove a configuration, select the configuration you want to delete. Then click on the top right of the page, and select Delete configuration. Once you have read the warning about alerts, to confirm the deletion, click the Delete button.
メモ
You can only use the ツールの状態ページ to remove configurations for the default branch of a repository. For information about removing configurations from non-default branches, see コード スキャン アラートを解決する.
Debugging using the tool status page
If you see that there is a problem with your analysis from the code scanning alerts page, you can use the ツールの状態ページ to identify the problem. For integrated tools, you can see specific error messages in the detailed information section, related to specific code scanning tools. These error messages contain information about why the tool may not be performing as expected, and actions you can take. For more information about how to access this section of the ツールの状態ページ, see Accessing detailed information about tools.
For integrated tools such as CodeQL, you can also use file coverage information to improve your analysis. For more information about interpreting file coverage percentages, see ツールの状態ページについて.
For more information, see コード スキャン分析エラーのトラブルシューティング and SARIF アップロードのトラブルシューティング.