Observação
O administrador do site precisa habilitar a code scanning antes que você possa usar esse recurso. Para saber mais, confira Como configurar a verificação de código do seu dispositivo.
Talvez você não consiga habilitar ou desabilitar o code scanning se um proprietário da empresa tiver definido uma política de GitHub Code Security no nível da empresa. Para saber mais, confira Como impor políticas para segurança e análise de código na empresa.
The página de status da ferramenta shows information about all of your code scanning tools and is a good starting point for debugging problems. For more information about what the tool is and the information it provides, see Sobre a página de status da ferramenta.
Viewing the página de status da ferramenta for a repository
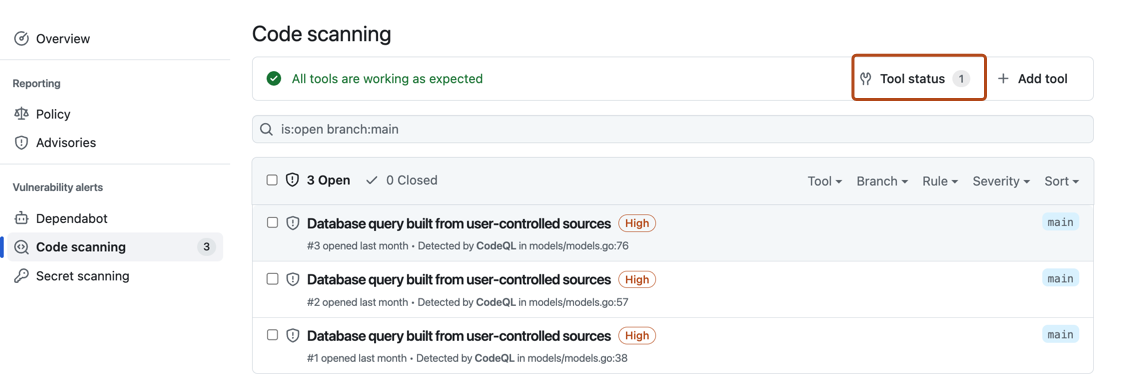
The code scanning alerts page for each repository includes a tools banner with a summary of the health of your code scanning analysis, and access to the página de status da ferramenta to explore your setup.
- Em GitHub, acesse a página principal do repositório.
- Abaixo do nome do repositório, clique em Security. Caso não consiga ver a guia "Security", selecione o menu suspenso e clique em Security.
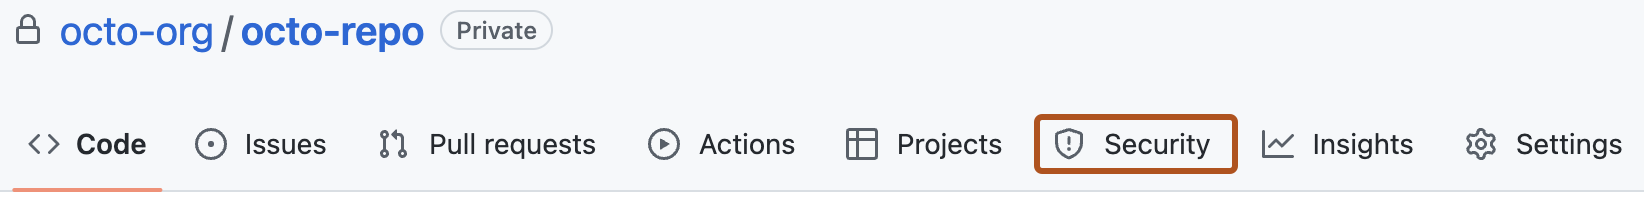
- Na barra lateral esquerda, clique em Code scanning.
- Click Tool status in the tools banner.


Using the página de status da ferramenta
In the página de status da ferramenta, you'll see a summary for one tool, highlighted in the sidebar. You can use the sidebar to view summaries for different tools.

For integrated tools such as CodeQL, you can see a percentage total of all the files most recently scanned in your repository, organized by programming language. You can also download detailed language reports in CSV format. See Downloading details of the files analyzed.
Accessing detailed information about tools
When you want to see more detailed information for the currently displayed tool, you can select a specific setup under "Setup types".
Under "Configurations" on the left of the screen, you can see information for each analysis run by this setup type, and any relevant error messages. To see detailed information about the most recent analysis run, select a configuration in the sidebar. You can download details of exactly which rules were run in that scan of the code and how many alerts were found by each rule. For more information, see Downloading lists of rules used.

This view will also show error messages. For more information, see Debugging using the tool status page.
Downloading details of the files analyzed
For integrated tools such as CodeQL, you can download detailed reports from the página de status da ferramenta in CSV format. This will show:
- Which configuration was used to scan each file
- The file path
- The programming language of the file
- Whether the file was successfully extracted
To download a report, select a tool you're interested in. Then on the top right of the page, click the button.
Downloading lists of rules used
You can download the list of rules that code scanning is checking against, in CSV format. This will show:
- The configuration used
- The rule source
- The SARIF identifier
- How many alerts were found
To download a report, select a configuration you're interested in. Then click on the top right of the page, and select Download list of rules used.
Removing configurations
You can remove stale, duplicate, or unwanted configurations for the default branch of your repository.
To remove a configuration, select the configuration you want to delete. Then click on the top right of the page, and select Delete configuration. Once you have read the warning about alerts, to confirm the deletion, click the Delete button.
Observação
You can only use the página de status da ferramenta to remove configurations for the default branch of a repository. For information about removing configurations from non-default branches, see Resolver alertas de varredura de código.
Debugging using the tool status page
If you see that there is a problem with your analysis from the code scanning alerts page, you can use the página de status da ferramenta to identify the problem. For integrated tools, you can see specific error messages in the detailed information section, related to specific code scanning tools. These error messages contain information about why the tool may not be performing as expected, and actions you can take. For more information about how to access this section of the página de status da ferramenta, see Accessing detailed information about tools.
For integrated tools such as CodeQL, you can also use file coverage information to improve your analysis. For more information about interpreting file coverage percentages, see Sobre a página de status da ferramenta.
For more information, see Solução de erros de análise de escaneamento de código and Solução de problemas de uploads SARIF.